The new team infographic!
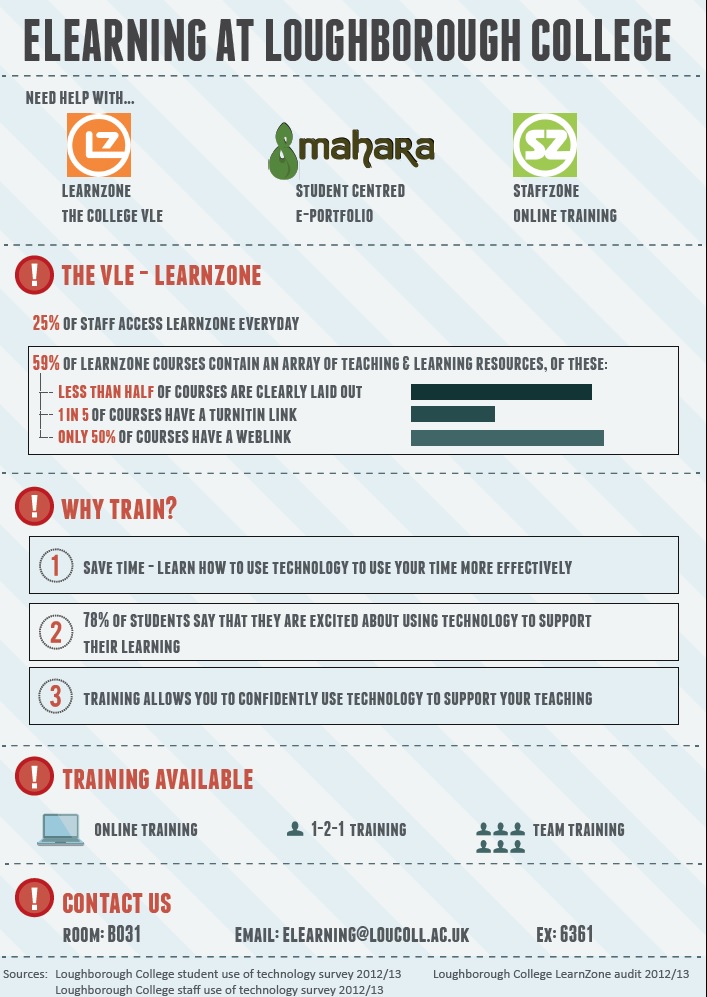
This infographic was created to visually highlight the presence of eLearning at Loughborough College, importantly it displays that there is a gap in the knowledge of staff, shows a need for training in this area and provides evidence of how staff could benefit from training. The College has recently been praised for its eLearning in the recent OFSTED report, however the team feels that there is room for training to reach our eLearning potential as a college.
Before starting work on the infographic I thoroughly researched what it should involve and what makes an infographic effective. Once I had done this I tried to plan what information that I might want on the infographic, I came up with the headings and the facts that I wanted to include. Once I was sure about these I collected statistics from the staff surveys and audits that the team had conducted over the past year to find statistics to go onto the infographic.
Making your own infographic
Why create an infographic?
Infographics are a good way of clearly displaying information, most infographics contain a lot of information – Mostly statistics.
Infographics can allow you to focus data that you have and clearly show how they all relate to the title of the infographic.
Good practices – Things to keep in-mind when creating an infographic
- Decide whether you want to print it out BEFORE you start to create your infographic –
- This is important as lots of infographics are not designed to be printed, instead they are designed to be viewed on a computer (or other device) where you can zoom into the image and see the words more clearly.
- If you do not intend to print the infographic then you can use smaller font than if you are going to print out the infographic, as the viewer will be sat closer to it and will be able to ‘zoom in’ if they need to.
- If you want to print the infographic then you should be careful of the font size that you are using, you should also decide what size that it will printed
- Infographics are a visual way to display information (facts and statistics) – Make sure that what you create is eye-catching, visually appealing and following basic design guidelines.
- Let the information guide your layout –
- Be clear about exactly what statistics and information that you want to include on your infographic
- Make sure that you have a clear progression of facts/data – tell a story (a linear narrative) with the information
- Reference your work! -Where have you got your facts from? If you don’t reference your stats/facts then how can people be sure that you haven’t made them up?
- References are often at the bottom of an infographic, this way they are out of the way, but can still be referred to, should the reader what to know where you have got your information from.
Examples of what other people have created
An infographic that covers some myths and facts about online learning. It has a clear introduction and clearly laid out sections for each of the facts/myths, each statistic has been laid out clearly and is prominent in the section.
http://www.myeducation.com/blog/infographic-7-myths-and-facts-about-online-learning/
http://www.quirk.biz/online-learning-infographic
http://visual.ly/social-media-statistics
Useful links
Use the links below to find out more information about how to create a clear and effective infographic.
Principles of effective infographics – http://www.psdhelpline.com/principles-of-effective-infographics/
This is an infographic about what makes a good infographic, it is clearly laid out, concise and is easy to understand – http://visual.ly/what-makes-good-infographic
Don’t feel confident enough to create an infographic using Adobe illustrator? Try using one of the tools mentioned in this article (no design knowledge necessary!) – http://readwrite.com/2013/06/10/5-tools-for-creating-your-own-infographics#awesm=~ocjvNLy5ydpjsv
Link to Infographic –
https://docs.google.com/a/student.loucoll.ac.uk/file/d/0B1k4lUridw74UTk2SkpjaGxJeGM/edit
A useful tool to help you create an infographic can be found online here; https://infogr.am/register
Mel Toal 2013